
记录zabbix低级自动发现的json格式,以及相应脚本

json格式如下:

{
“data”: [
{
“{#HOSTIP}”: “/var/log/audit”
},
{
“{#HOSTIP}”: “/var/log/chrony”
},
{
“{#HOSTIP}”: “/var/log/cups”
},
{
“{#HOSTIP}”: “/var/log/gdm”
},
{
“{#HOSTIP}”: “/var/log/glusterfs”
},
{
“{#HOSTIP}”: “/var/log/httpd”
},
{
“{#HOSTIP}”: “/var/log/mariadb”
},
{
“{#HOSTIP}”: “/var/log/ntpstats”
},
{
“{#HOSTIP}”: “/var/log/php-fpm”
},
{
“{#HOSTIP}”: “/var/log/pluto”
},
{
“{#HOSTIP}”: “/var/log/ppp”
},
{
“{#HOSTIP}”: “/var/log/qemu-ga”
},
{
“{#HOSTIP}”: “/var/log/sa”
},
{
“{#HOSTIP}”: “/var/log/samba”
},
{
“{#HOSTIP}”: “/var/log/speech-dispatcher”
},
{
“{#HOSTIP}”: “/var/log/sssd”
},
{
“{#HOSTIP}”: “/var/log/tuned”
}
]
}

产生该json格式的python代码参考:

#!/usr/bin/env python3
#encoding=utf-8
import os
import sys
import json

FileDir=’/var/log/’

def CheckHostip(filedir):
output = os.popen(‘find ‘+filedir+’* -maxdepth 0 -type d’)
hostip = str(output.read())
hostip = hostip[:hostip.find(‘\r’)]
hostdirlist = hostip.split(‘\n’)
return (hostdirlist)

def returnjson(fileDir):

thislist=[]
for i in CheckHostip(fileDir):
thislist.append({
“{#HOSTIP}”:i

})
a = {
“data”: thislist
}
print(json.dumps(a, sort_keys=True, indent=2))
return 1

if __name__==”__main__”:
returnjson(FileDir)
记录使用Python监控服务器日志。

后续直接使用了宏,因此这个Python脚本没用了,但是还是觉得有意义,所以记下来。

#!/usr/bin/env python3
#encoding=utf-8
import os
import socket
from pyzabbix import ZabbixAPI, ZabbixAPIException
import sys
import warnings
import time

ServerName=”ServerNameHere”
Username=’usernamehere’
Passwd=’passwdhere’
Url=’https://zabbix.mytlu.cn’
FileDir=’/var/log/’
MonitorFilename=’/log’

def CheckHostip(filedir):
output = os.popen(‘find ‘+filedir+’* -maxdepth 0 -type d’)
hostip = str(output.read())
hostip = hostip[:hostip.find(‘\r’)]
hostdirlist = hostip.split(‘\n’)
return (hostdirlist)

def CheckZabbixItems(LogDir):
warnings.filterwarnings(‘ignore’)
ZABBIX_SERVER = Url
zapi = ZabbixAPI(ZABBIX_SERVER)
zapi.session.verify = False
zapi.login(Username, Passwd)
hostid=zapi.host.get(
filter={
“host”:ServerName
}
)
hostid=hostid[0][‘hostid’]
pre_interfaceid = zapi.hostinterface.get(
hostids=hostid
)
interfaceid = pre_interfaceid[0][‘interfaceid’]
try:
itemget = zapi.item.get(
hostid=hostid,
search={
“key_”: “vfs.file.md5sum[“+LogDir+MonitorFilename+”]”
},
sortfield=”name”
)
print(itemget)
if itemget == []:
print(‘zabbix里没有该监控项,添加中监控项和触发器中…’)
CreateItems(LogDir, interfaceid, hostid)
CreateTrigger(LogDir)
return 1
else:
print(‘zabbix里有该监控项,尝试添加中触发器中…’)
try:
CreateTrigger(LogDir)
except:
return 0
return 1
except Exception as e:
print(‘zabbix里没有该监控项,添加中监控项和触发器中…’)
CreateItems(LogDir,interfaceid,hostid)
CreateTrigger(LogDir)
return 1

def CreateItems(LogDir,interfaceid,hostid):
warnings.filterwarnings(‘ignore’)
ZABBIX_SERVER = Url
zapi = ZabbixAPI(ZABBIX_SERVER)
zapi.session.verify = False
zapi.login(Username,Passwd)
item = zapi.item.create(name=”Monitor_Log:”+LogDir+MonitorFilename,
key_=”vfs.file.md5sum[“+LogDir+MonitorFilename+”]”,
hostid=hostid,
type=0,
value_type=1,
delay=”10s”,
interfaceid=interfaceid
)
print(item)
return 1

def CreateTrigger(LogDir):
warnings.filterwarnings(‘ignore’)
ZABBIX_SERVER = Url
zapi = ZabbixAPI(ZABBIX_SERVER)
zapi.session.verify = False
zapi.login(Username, Passwd)
trigger = zapi.trigger.create(
description=”[“+LogDir+MonitorFilename+”]:Log not changed in 1s”,
expression=”{“+ServerName+”:vfs.file.md5sum[“+LogDir+MonitorFilename+”].change()}=0″,
priority=’4′,
manual_close=’1′

)
print(trigger)
return 1

if __name__==’__main__’:
hostdirlist=CheckHostip(FileDir)
print(hostdirlist)
for i in hostdirlist:
CheckZabbixItems(i)

Centos 7 添加Systemct任务 配置开机自启

[Unit]
Description=Simple-Drive.mytlu.python
After=network-online.target
[Service]
User=root
Type=simple
#Environment=”PATH=/simpledrive-demo”
WorkingDirectory=/simpledrive-demo
ExecStart=/usr/local/bin/python3 -u /simpledrive-demo/main.py > /simpledrive-demo/main.log 2>&1
ExecReload=/bin/kill -HUP $MAINPID
ExecStop=/bin/kill -TERM $MAINPID
KillMode=process
Restart=no
[Install]
WantedBy=multi-user.target
WantedBy=graphical.target

注意,Environment以及WorkingDirectory都在配置文件里。WorkingDirectory对于Python运行比较重要。另外,该文件存于/usr/lib/systemd/system/simpledrive-demo.mytlu.python.service。另外运行完记得systemctl daemon-reload来刷新。

以下*代替相关服务。

systemctl start * 开启service

systemctl enable * 开启开机自启

systemctl status * -l 查看服务状态。

Zabbix 监控Mysql Slave

  1. userparameter_mysql_slave_status.conf 放置到 /etc/zabbix/zabbix_agent.d/下。

详细配置内容:

# For all the following commands HOME should be set to the directory that has .my.cnf file with password information.

# Flexible parameter to grab global variables. On the frontend side, use keys like mysql.status[Com_insert].
# Key syntax is mysql.status[variable].
UserParameter=mysql.slave.status[*], echo ‘show slave status\G;’ | mysql | awk ‘$$1 ~ /$1/ {print $$2}’

# Flexible parameter to determine database or table size. On the frontend side, use keys like mysql.size[zabbix,history,data].
# Key syntax is mysql.size[,

,].
# Database may be a database name or “all”. Default is “all”.
# Table may be a table name or “all”. Default is “all”.
# Type may be “data”, “index”, “free” or “both”. Both is a sum of data and index. Default is “both”.
# Database is mandatory if a table is specified. Type may be specified always.
# Returns value in bytes.
# ‘sum’ on data_length or index_length alone needed when we are getting this information for whole database instead of a single table

2. 修改上述配置文件中 UserParameter=mysql.slave.status[*], echo ‘show slave status\G;’ | mysql | awk ‘$$1 ~ /$1/ {print $$2}’

具体来说,如果.my.cnf在 /etc/zabbix下。那么改为:

UserParameter=mysql.slave.status[*], echo ‘show slave status\G;’ |HOME=/etc/zabbix mysql | awk ‘$$1 ~ /$1/ {print $$2}’

参考文档

如何解决服务器访问/加载过慢

最近发现本站点服务器访问缓慢,检查发现以下问题:

  1. 架构:云服务器代理>SSH打洞>本地树莓派服务器。云代理服务器每次接收到请求后,都需要通过SSH打洞转发到本地树莓派服务器,本地服务器与云服务器的延迟被反复放大。
  2. 服务器TCP连接卡在TIME_W上的进程特别多。查看服务器连接数:
[root@localhost etc]# netstat -ant | grep $ip:80 | grep TIME_W | wc -l
421
[root@localhost etc]# netstat -ant|awk '/^tcp/ {++S[$NF]} END {for(a in S) print (a,S[a])}'
LISTEN 23
SYN_RECV 14
CLOSE_WAIT 61
ESTABLISHED 32
FIN_WAIT2 57
TIME_WAIT 430
[root@localhost etc]# netstat -ant | grep $ip:80 |wc -l
578
[root@localhost etc]# netstat -ant | grep $ip:80 | grep TIME_W | wc -l
450
[root@localhost etc]#  netstat -ant | grep $ip:80 | grep ESTABLISHED | wc -l
6
[root@localhost etc]# 

3. 云服务器带宽过低,1M带宽。

初步解决方案:

  1. 暂时没什么好的办法。
  2. 参考 这篇文章,尝试优化服务器TCP连接,没卵用,已回退。而且这里面的”net.ipv4.tcp_tw_recycle “,Centos7已弃用。
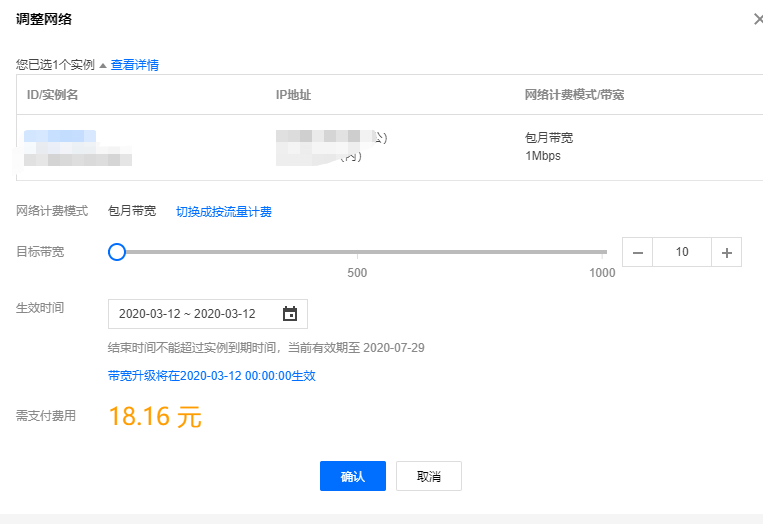
  3. 掏钱,升级云服务器带宽,效果拔群。

总结:花钱是最快的办法。

Mysql数据库备份与恢复

1.数据库备份

mysqldump -u用户名 -p密码  --opt --skip-lock-tables 数据库名 > /备份文件夹/文件名.sql

注意:-p密码可以省略,密码明文出现,会在history中留记录,不安全。skip-lock-tables选项,不锁数据库备份,加速备份速度。

2. 数据库备份文件还原

mysql -u用户名 -p密码 < /备份文件夹/文件名.sql

注意,同样不建议明文密码。

树莓派检测CPU温度

代码是Python2代码,适当修改为长输出。可自行改为python3.

代码附赠了CPU负载和内存使用情况

代码引用地址:
https://gist.github.com/582033/b94dc1d4941f63bb28d837fa9c72f08d

#!/usr/bin/env python
# -*- coding: utf-8 -*-
'''
显示树莓派cpu温度、使用率及内存使用率
'''

import os
import time

def show_temp():
    file = open("/sys/class/thermal/thermal_zone0/temp")
    temp = float(file.read()) / 1000
    file.close()
    print "Temp: %.1f ℃" %temp


def show_mem():
    mem_cmd = "free -m | grep Mem | awk '{print ($4+$6)/$2}'"
    mem_sur = round(float(os.popen(mem_cmd).read()), 2) * 100
    print "Mem avail: %d%%" % mem_sur


def show_cpu():
    cpu_cmd = "uptime | awk '{print $8,$9,$10,$11,$12}'"
    cpu_used = os.popen(cpu_cmd).read()
    print "Cpu Used: %s" % cpu_used.replace('\n', '')


if __name__ == '__main__':

    while 1:
        show_temp()
        show_cpu()
        show_mem()
        print ">>>>>>>>>>>>>>>>>>>>>>>>>>>>>>>>>>>>>>>>>>"
        time.sleep(2)

树莓派SSH打洞再探

详细打洞方案请参考
https://blog.mytlu.cn/?p=6

目前,将云端的俩个Python Flask WEB服务迁移到本地树莓派上,并SSH打洞发布。添加Systemctl开机自启。

将本地树莓派Centos7 22端口映射到公网服务器某端口。测试可用

本地树莓派状态可以通过之前写的SimpleDrive-demo的调试页面看到。

网址:
https://simpledrive-demo.mytlu.cn/serverstatus

复制状态信息如下:

有新版本103可更新
以下是系统信息(每隔5秒自动刷新):
操作系统:Linux
(‘内存已使用:’, 336.015625, ‘M’, ‘总内存:’, 924.9921875, ‘M’, ‘内存占比:’, 38.8, ‘cpu个数:’, 4)
守护进程信息:
待添加
以下是磁盘信息/单位(G)
总计:13.839794158935547 已用:4.8215179443359375 剩余: 8.988677978515625 已用比例:34.9